The EU Methane Regulation is reshaping emissions reporting and methane management worldwide. Learn what it means for operators and how SeekOps can help support compliance and emissions reduction efforts for your company.
Read time: 5 minutes
Methane has increased in priority within regulation to no longer being just an environmental concern. With the European Union’s Methane Regulation (EU 2024/1787) now coming to center stage, operators across the oil and gas value chain are facing a new period of measurement, reporting, verification, and emissions reduction requirements.
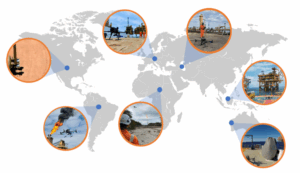
While much of the discussion has focused on European operators, the regulation’s impact extends well beyond the EU’s borders. Because Europe imports a significant portion of its oil and gas, the regulation also introduces new expectations for producers and exporters supplying energy into European markets. Yes, this means any asset along the value chain even if it’s located anywhere from Malaysia to Nigeria to Texas.
For operators, the message is clear that methane emissions must increasingly be measured, understood, documented, and reduced using transparent and defensible methodologies.
This update creates some obstacles, but it also creates an opportunity to improve emissions visibility and strengthen confidence in reported data.
What Is the EU Methane Regulation?
The European Union Methane Regulation (EU 2024/1787) establishes requirements for the measurement, monitoring, reporting, verification, and reduction of methane emissions across the oil, gas, and coal sectors. The regulation covers several key areas:
• Monitoring, Reporting, and Verification (MRV)
• Leak Detection and Repair (LDAR)
• Restrictions on routine venting and flaring
• Transparency requirements for imported fossil fuels
• Methane intensity reporting for imported energy products
The regulation entered into force in August 2024 and will be implemented through a number of phases extending through 2030. Over time, the requirements will become increasingly focused on direct measurement and transparent reporting rather than reliance on generalized emission factors.
Why This Regulation Is Different
Previous methane regulations have often focused primarily on operators with specific qualifications. The EU regulation is different because it doesn’t differentiate between assets.
The regulation applies not only to EU-based operators but also introduces reporting and transparency requirements for any fossil fuels (oil, gas, and coal) imported into the European market. As implementation continues, importers will increasingly need to demonstrate the quality of methane emissions data associated with their supply chains and provide information on methane management practices used by upstream producers.
Why This Matters for U.S. Exporters
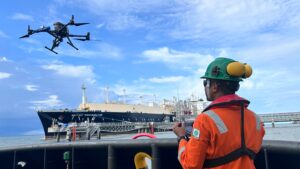
Although the EU Methane Regulation is a European policy, its implications extend far beyond Europe’s borders. For U.S. oil and gas producers exporting LNG, crude oil, or other energy products into European markets, methane performance is now part of commercial discussions.
In the near term, U.S. Exporters will find the most practical pathway for demonstrating compliance with the regulation’s import transparency requirements is alignment with OGMP 2.0 Level 5 reporting, which emphasizes site-level measurements supported by robust methodologies and independent verification. While the regulation allows for the possibility of country-level equivalence determinations in the future, those frameworks are not expected to be available for several years. As a result, operators seeking to demonstrate alignment with the EU’s “highest monitoring standards” will likely need to rely on site- and source-level measurement programs.
The shift is already underway. European buyers are increasingly requesting methane emissions data from suppliers to support their own reporting obligations under the regulation. What was once a voluntary sustainability metric is becoming an operational and commercial consideration across global supply chains.
For operators with mature measurement programs, this creates an opportunity. High-quality emissions data can help demonstrate methane performance, support low-emissions energy claims, and provide transparency to customers and stakeholders. Conversely, operators with limited measurement data may find their methane performance subject to increasing scrutiny as reporting requirements expand and emissions information becomes more publicly available through mechanisms such as the EU’s planned Methane Transparency Database.
One challenge facing the industry is that independent verification capacity remains limited. While the regulation establishes requirements for third-party verification and references existing European accreditation frameworks, the infrastructure needed to support verification at scale is still developing. This makes early preparation particularly valuable for operators seeking to stay ahead of evolving requirements.
The Shift Toward Measurement-Based Reporting
One of the most significant aspects of the regulation is its emphasis on measurement-based emissions management.
Historically, many methane inventories relied heavily on bottom-up calculations using equipment counts and emission factors. While these approaches remain important, the regulation is pushing the industry toward more direct measurement and verification of emissions.
This evolution reflects a broader industry trend. Operators increasingly need to answer questions such as:
• Where are emissions occurring?
• How much methane is being emitted?
• How confident are we in the measurement?
• How do measured emissions compare to inventory estimates?
• Are emissions changing over time?
Answering these questions requires measurement technologies capable of producing defensible, repeatable data under real operating conditions.
The Growing Importance of LDAR Programs
The regulation also places significant emphasis on Leak Detection and Repair (LDAR) programs.
Operators are required to implement regular monitoring programs, identify methane emissions sources, and take timely corrective action when leaks are detected. Repair timelines and documentation requirements are intended to ensure that emissions are not only identified but also repaired when applicable.
For many operators, this means moving beyond periodic inspections and toward a more comprehensive understanding of site-level emissions behavior.

How SeekOps Supports Compliance and Emissions Management
While regulations define the requirements, operators still need practical tools to meet them.
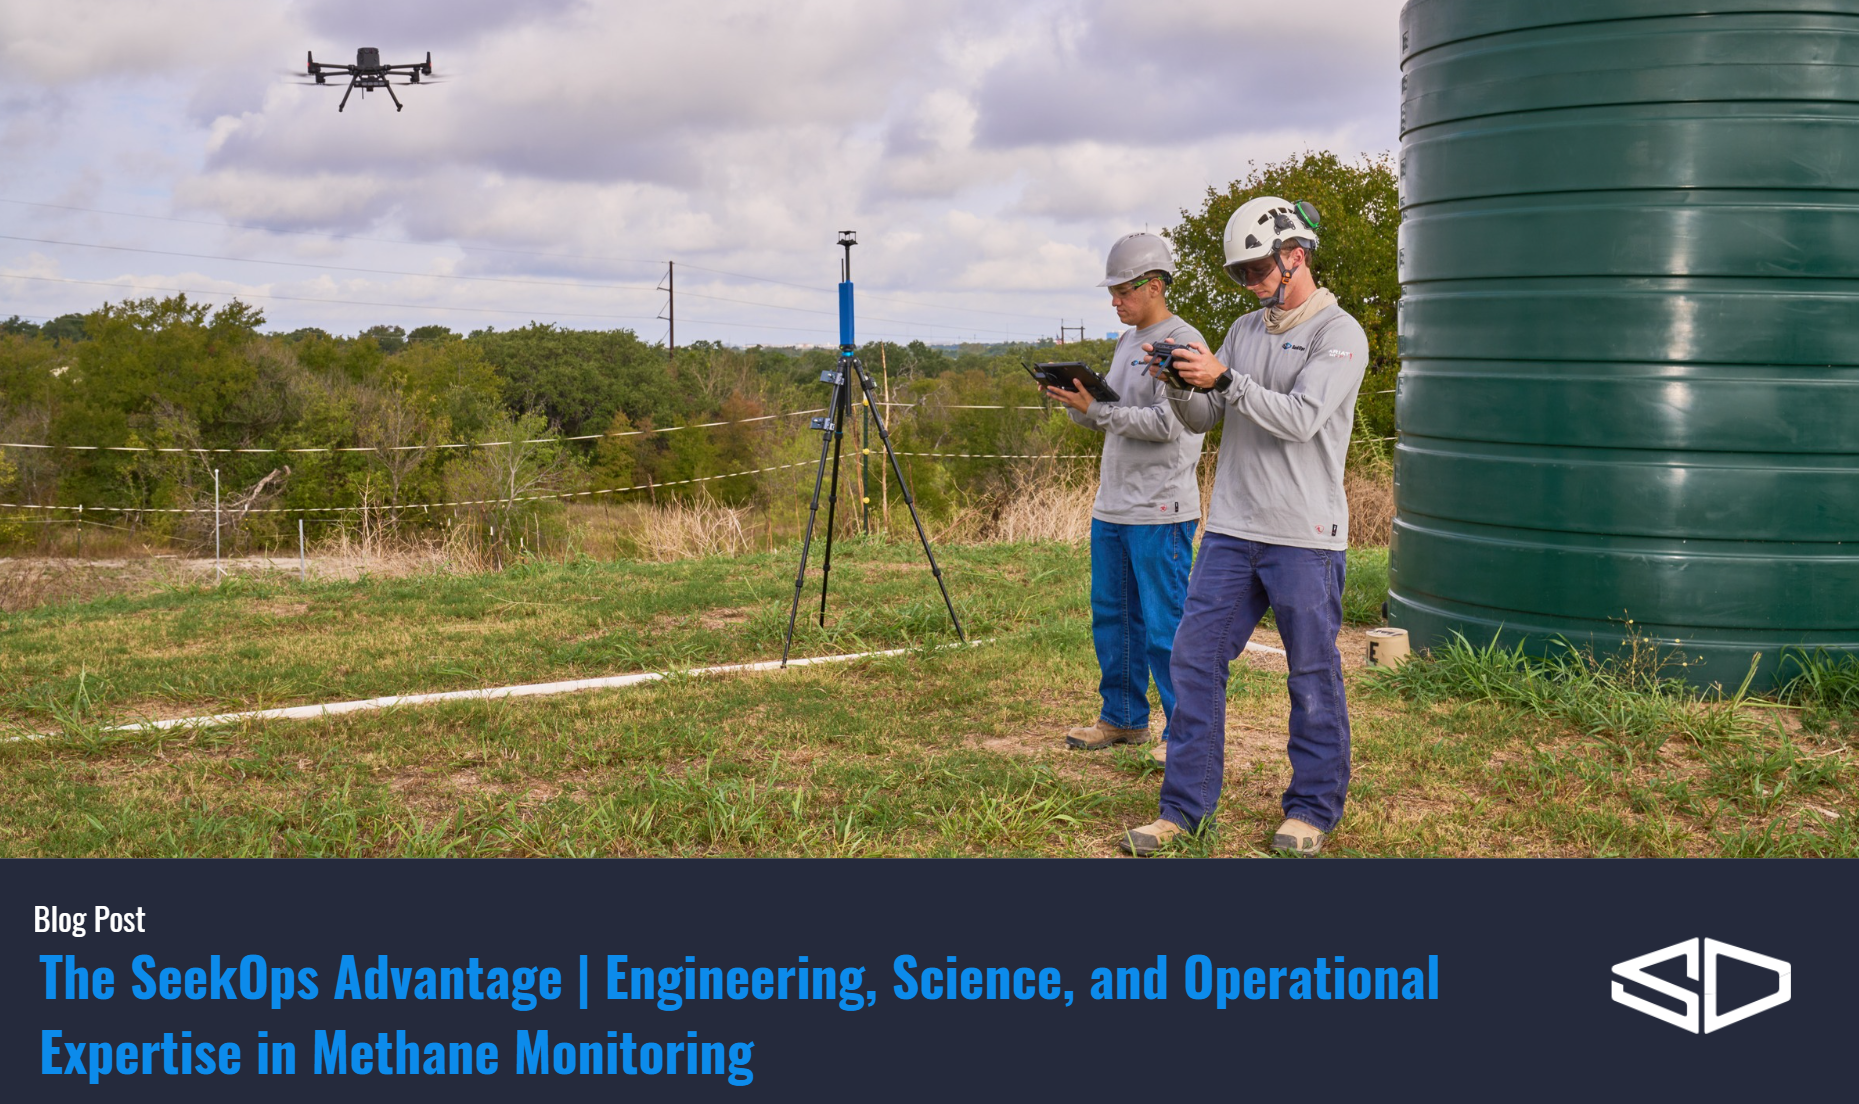
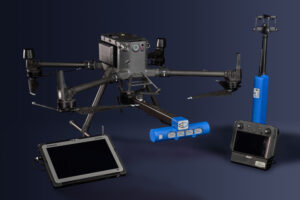
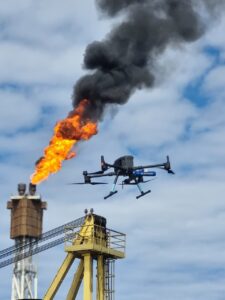
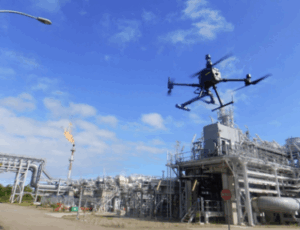
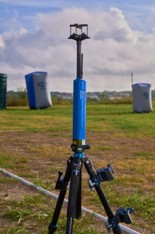
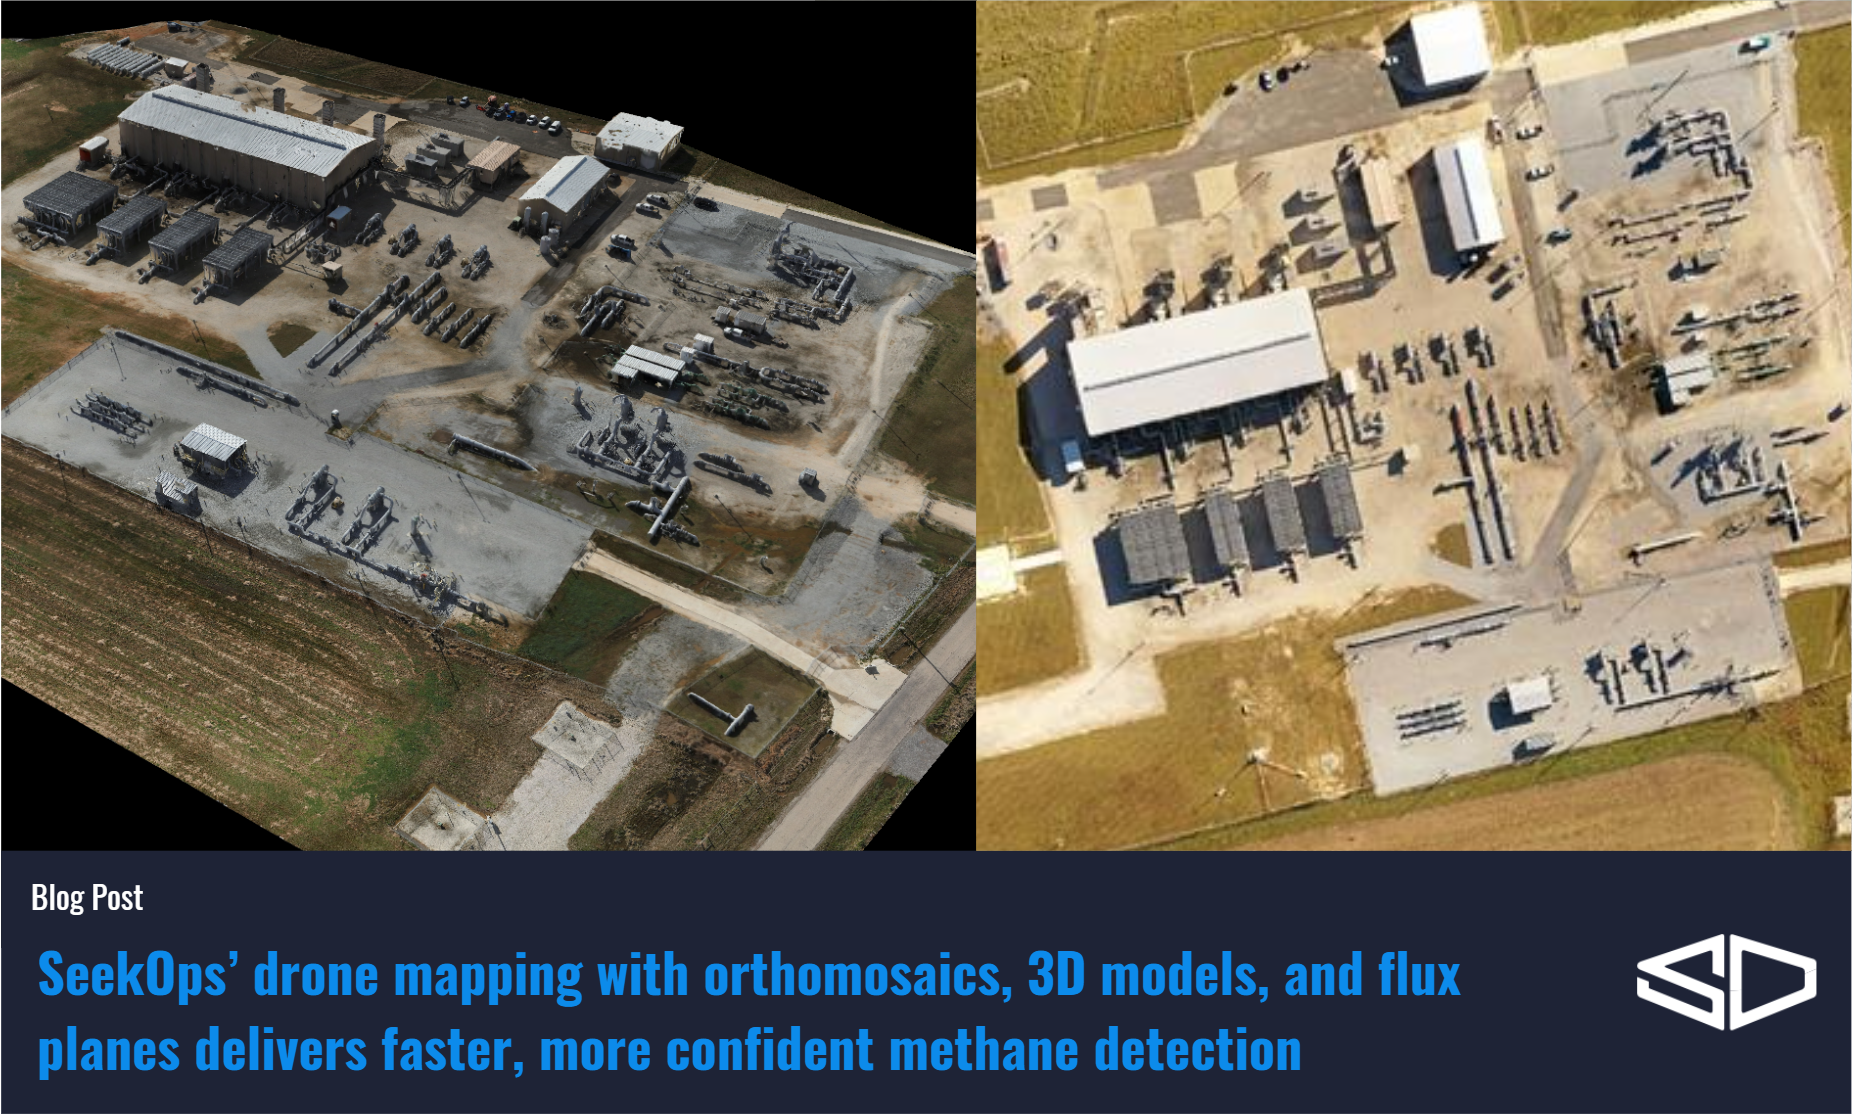
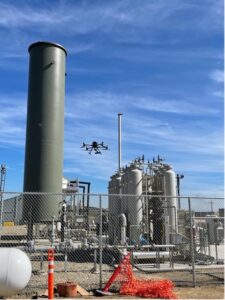
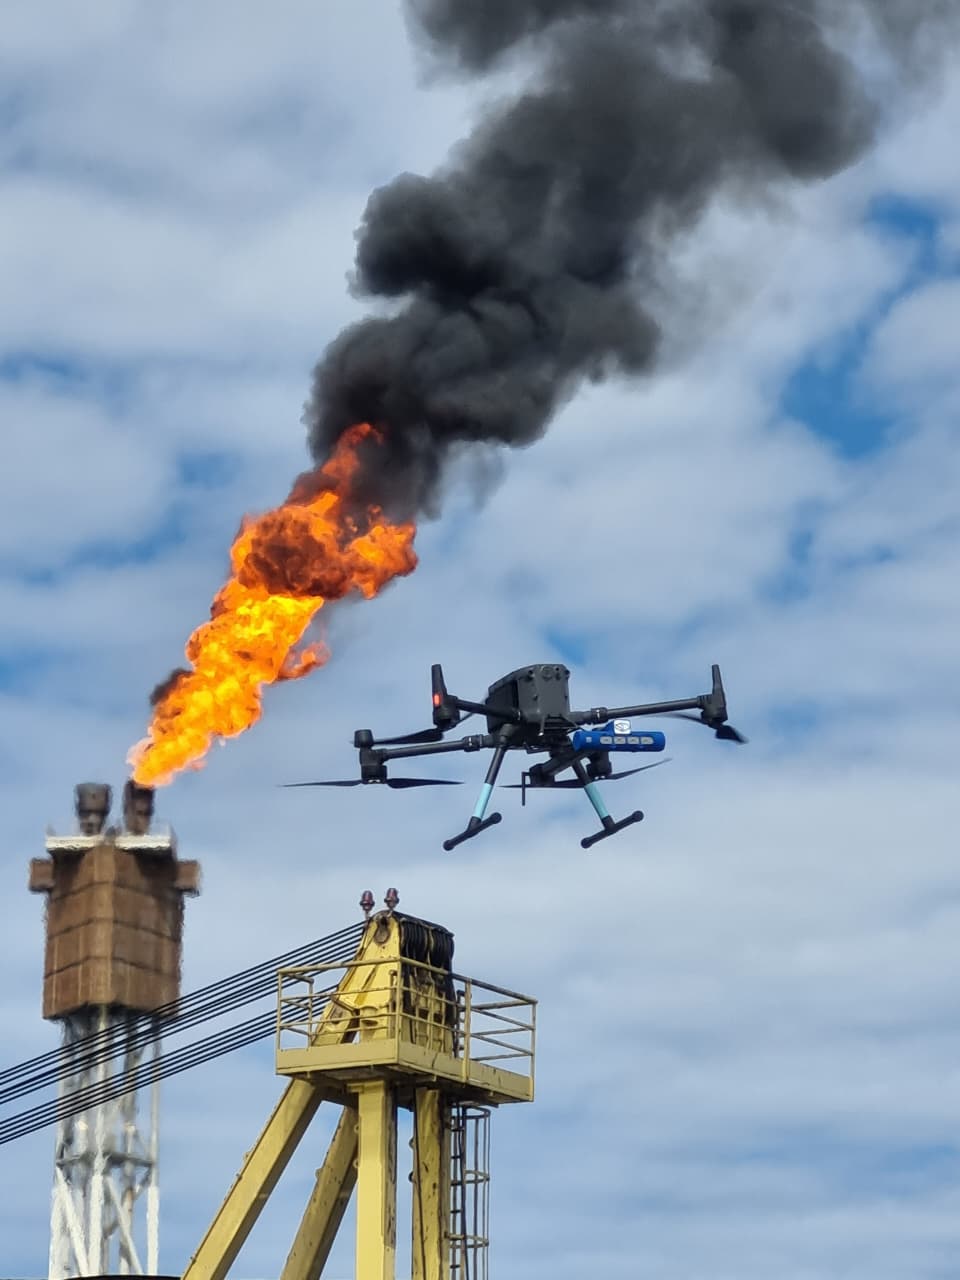
SeekOps supports methane management programs through direct measurement and quantification of emissions using UAV-based sensing technology. Unlike many screening approaches that identify the presence of methane, SeekOps is designed to quantify emissions and provide the data needed to support measurement-informed decision making.
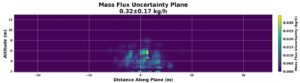
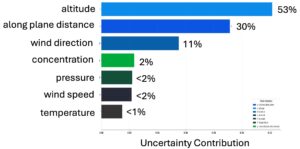
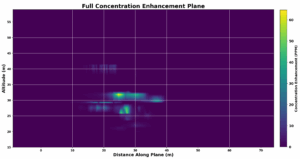
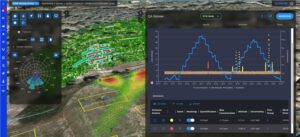
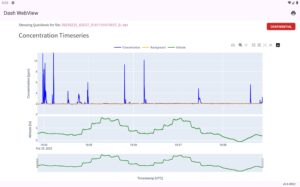
Our methodology combines methane concentration measurements with in-situ environmental measurements collected during flight. Wind speed, wind direction, temperature, and atmospheric conditions are measured directly and incorporated into the quantification process.
This approach provides several benefits that align closely with the objectives of the EU regulation.

Measurement-Based Quantification
As reporting frameworks increasingly move toward measured emissions rather than generalized assumptions, operators need reliable methods for quantifying methane.
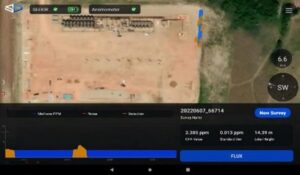
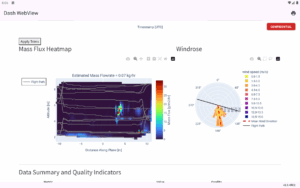
SeekOps’ top-down quantification approach measures emissions as they exist in the atmosphere, providing an independent assessment of site-level emissions that can complement traditional inventory methods.
Support for LDAR Programs
SeekOps measurements can help operators identify and prioritize significant emission sources for investigation and repair. By quantifying emissions, operators can focus mitigation efforts where they will have the greatest impact.
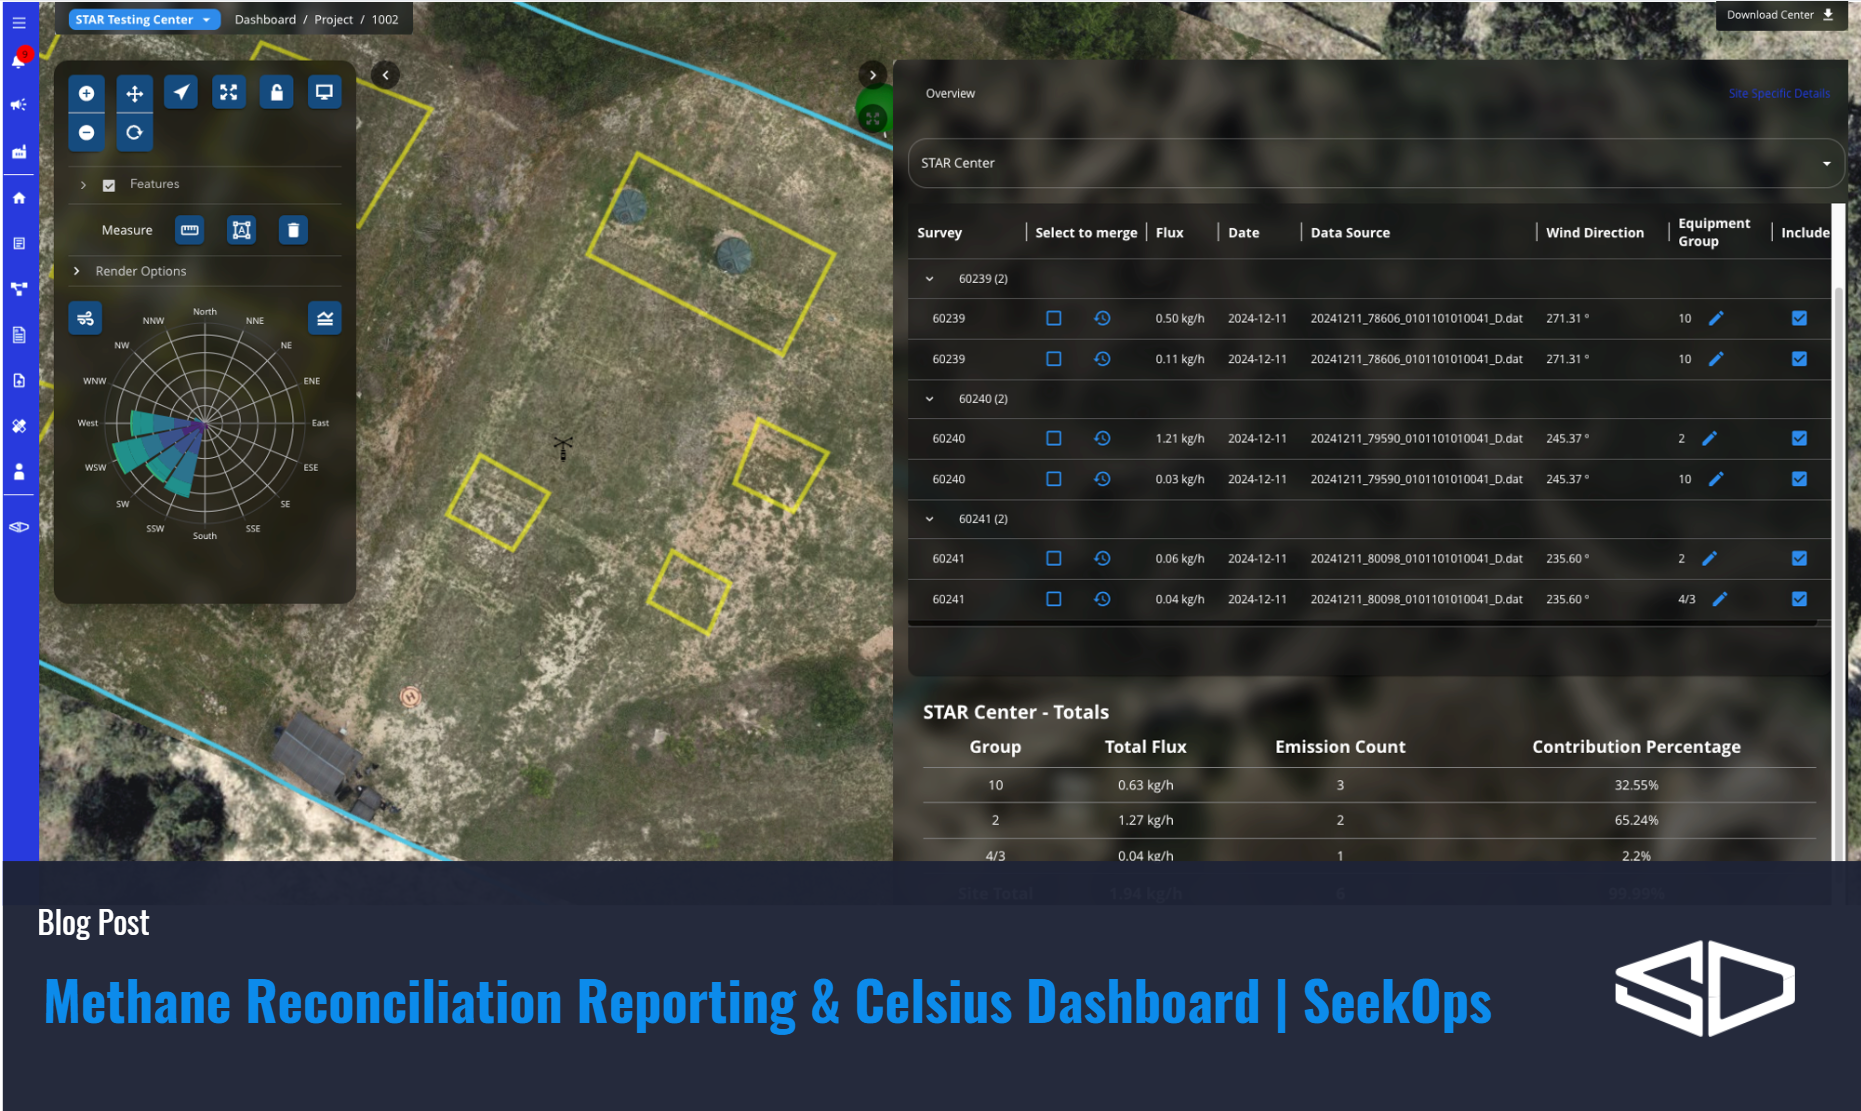
Inventory Reconciliation
One of the challenges many operators face is understanding differences between measured emissions and inventory estimates.
SeekOps measurements provide an independent dataset that can help operators validate inventories, investigate discrepancies, and improve emissions reporting accuracy.
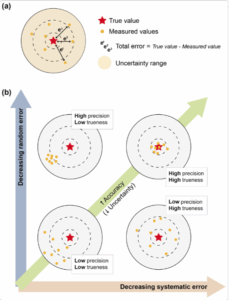
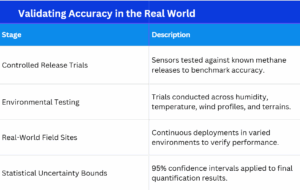
Transparent Uncertainty
Increasing regulatory scrutiny means confidence in measurement results matters as much as the measurements themselves.
SeekOps is unique in its ability to measure key environmental variables in-situ during each survey and propagate those uncertainties through the quantification process. The result is a measurement accompanied by a transparent uncertainty estimate tied directly to the conditions experienced during the survey. This additional layer of transparency helps operators understand not only what was measured, but how confident they can be in the result.
Looking Beyond Compliance
Although the EU Methane Regulation is often discussed in terms of compliance, its broader significance is that it accelerates the industry’s transition toward measurement-informed emissions management.
Operators that develop robust methane measurement programs today will be better positioned to respond to future reporting requirements, investor expectations, customer requests, and regulatory changes.
Measurement-based approaches can also provide operational benefits beyond compliance by helping operators:
• Identify emissions reduction opportunities
• Verify mitigation effectiveness
• Improve inventory accuracy
• Demonstrate environmental performance
• Strengthen stakeholder confidence
Preparing for the Future
The EU Methane Regulation represents one of the most comprehensive methane frameworks implemented to date. Its influence is expected to extend well beyond Europe as operators, importers, and regulators adopt more transparent approaches to methane management.
For operators, success will depend on the ability to move beyond estimates and toward defensible measurement.
SeekOps is helping support that transition by providing direct methane quantification, in-situ environmental characterization, and transparent uncertainty estimation that align with the industry’s growing demand for high-quality methane data.
As methane management continues to evolve, accurate measurement will increasingly become the foundation where effective reporting, mitigation, and operational decision-making are built.
References
European Union. (2024). Regulation (EU) 2024/1787 on the reduction of methane emissions in the energy sector. EUR-Lex. https://eur-lex.europa.eu/eli/reg/2024/1787/oj/eng
International Energy Agency (IEA). EU regulation on the reduction of methane emissions in the energy sector. https://www.iea.org/policies/18209-eu-regulation-on-the-reduction-of-methane-emissions-in-the-energy-sector
Oxford Institute for Energy Studies. Analysing the EU Methane Regulation: what is changing, for whom and by when? https://www.oxfordenergy.org/publications/analysing-the-eu-methane-regulation-what-is-changing-for-whom-and-by-when/