Discover what methane plumes are, how they form, and why detecting them matters for climate change, regulatory compliance, and sustainability goals.
Read time: 5 minutes
Invisible Emissions with Big Consequences
You can’t see methane with your eyes, but that doesn’t mean it’s not there.
Methane is a colorless, odorless gas that escapes from oil and gas operations, landfills, wastewater plants, and agricultural sites around the world. When it leaks into the atmosphere, it often forms what’s known as a plume, a drifting cloud of methane that moves and disperses with the wind.
These plumes can vary in size, shape, and intensity, but they all represent unaccounted emissions, and in many cases, significant sources of greenhouse gases. Methane is over 80 times more potent than carbon dioxide at trapping heat over a 20-year period, which makes its early detection and quantification a critical tool in mitigating climate change.
So, What Exactly Is a Plume?
A plume is simply a section of air where methane concentrations are higher than normal due to a nearby emission source.
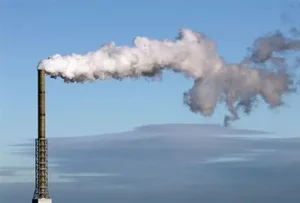
Think of it like smoke from a fire: as methane leaks out of equipment or piping, it gets caught in the wind and begins to drift. This creates a “cloud” of gas, but unlike smoke, methane is invisible to the naked eye.
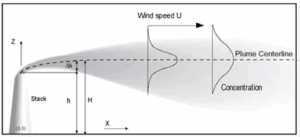
The size and direction of a plume are influenced by several things such as wind speed and direction, atmospheric temperature and humidity, terrain and structures (buildings, tanks, trees), and emission rate and duration.
Because of these variables, plumes can be short and dense, or long and diffuse. And unless you have specialized equipment, they can go completely unnoticed.
How Plumes Are Detected
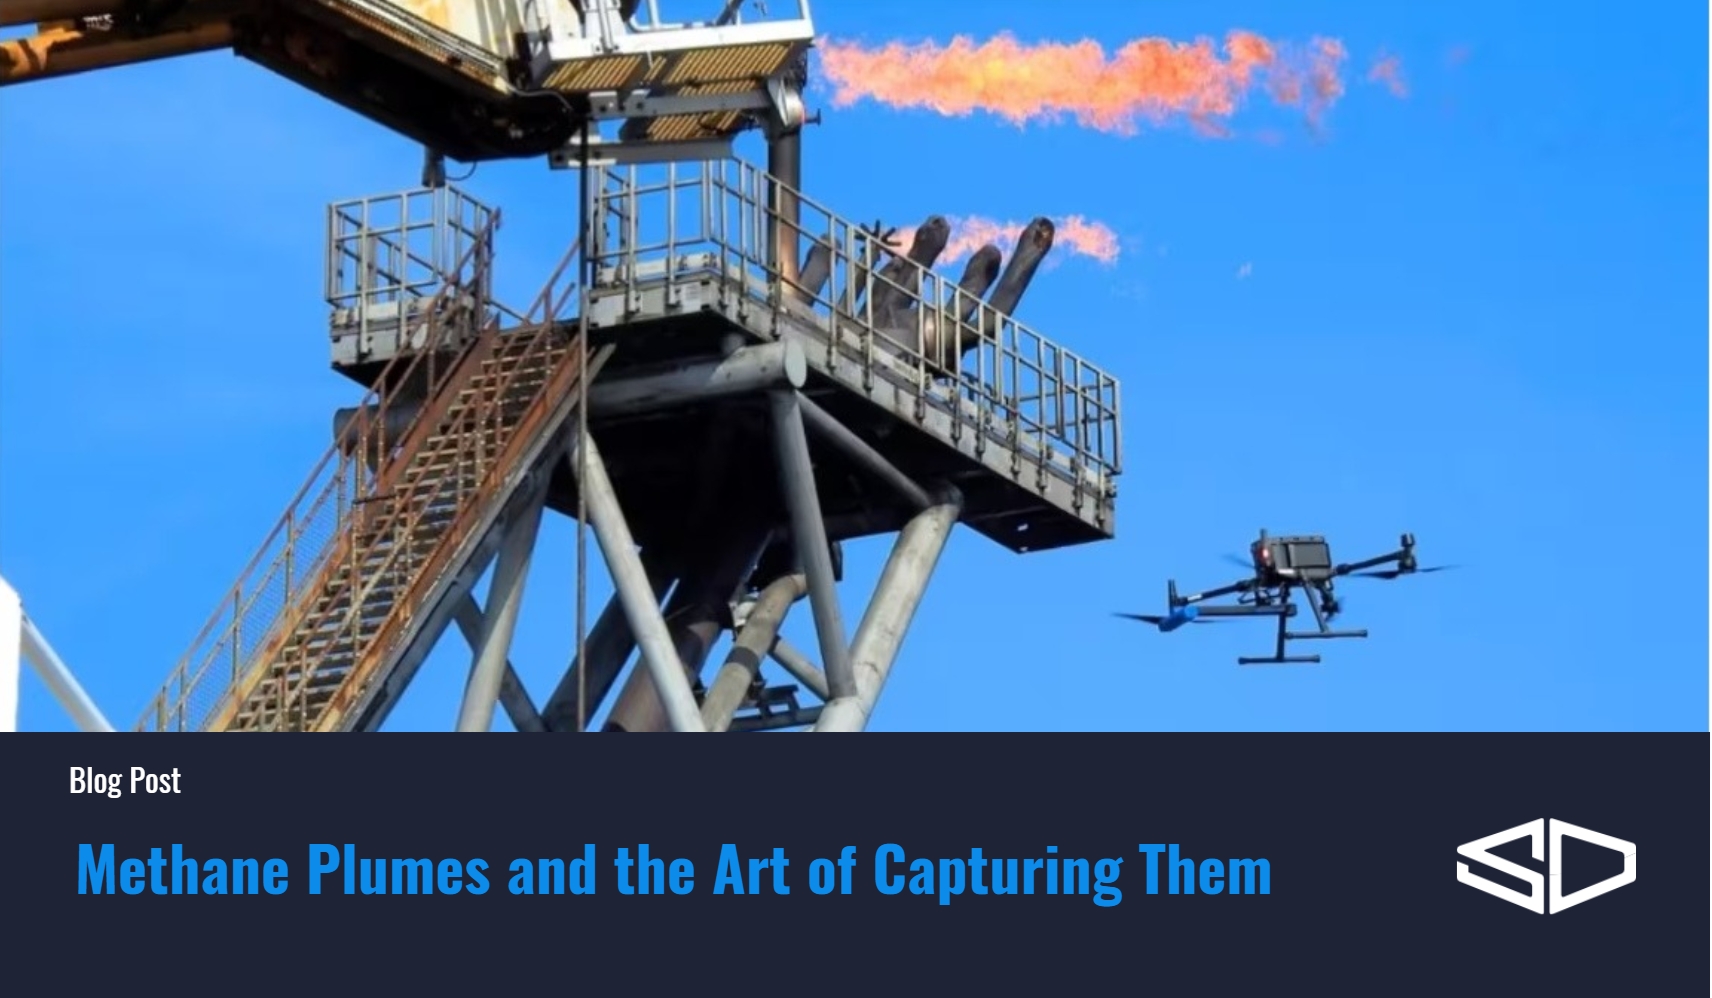
Detecting a methane plume requires remote sensing technology, or tools that can scan the air in place and identify gas concentrations without needing to interfere with industrial operations.
SeekOps uses a highly sensitive laser-based sensor mounted on drones. The sensor works using wavelength modulation spectroscopy, which allows us to “see” the methane in the air by measuring how laser light is absorbed as it passes through the gas.
Our drones fly over facilities in planned patterns, creating a 3D map of methane concentration in space and time. This not only identifies the plume but also helps trace it back to its source.
A top-down illustration of methane puffs as an unmanned aerial vehicle (UAV) moves through the plume.
Going Where Others Can’t
Our drones can fly close to sources (like tanks and flares) without interfering with operations, over uneven terrain and over water, which is nearly impossible for ground teams, and at high altitudes, sometimes up to 50 meters above the ground, to catch the full vertical profile of the plume.
The drone systems are equipped with anti-collision sensors, pre-programmed flight paths, and built-in no-fly zones. Meaning we can safely conduct surveys without flying over people or sensitive equipment.
By being mobile, we can adapt to changing winds, reach difficult areas, and make sure no emission goes unnoticed.
Where Do Methane Plumes Come From?
Methane plumes can come from a wide variety of sources, including:
- Oil and gas equipment (leaky valves, tanks, pipelines)
- Abandoned or orphaned wells
- Landfills and composting sites
- Wastewater treatment plants
- Biogas and RNG facilities
- Agricultural operations (especially manure and rice cultivation)
Sometimes, plumes form from routine operations such as tank venting or flaring. Other times, they result from accidental or fugitive leaks. Either way, detecting and quantifying these plumes is the first step toward managing and reducing emissions.
Visualization of how air flows impact the movement of methane plumes.
What Plumes Tell Us
Each plume tells a story.
A small, consistent plume might indicate a slow leak from a valve. A large, concentrated plume could point to a sudden release or equipment failure. In some cases, operators may not even know a leak exists until it’s detected by an aerial survey.
By mapping the plume’s shape and location, we can estimate where it started and how fast methane is escaping.
This data is crucial for regulatory reporting, operational efficiency, safety, and ESG compliance.
Why Plumes Matter for Climate and Compliance
Methane is responsible for nearly 30% of global warming to date, and many governments are introducing stricter rules to reduce emissions across industries.
Plume detection helps meet these regulations in several ways:
- Verifiable Measurement: Proves that you know your emissions footprint.
- Source Identification: Supports root cause analysis and repair.
- Trend Tracking: Shows whether emissions are increasing or decreasing over time.
- Reporting Accuracy: Backs up regulatory submissions with real data.
And beyond compliance, every plume that’s identified and stopped means fewer greenhouse gases in the atmosphere and less lost product, translating to cost savings and climate benefits.
What We Do with the Data
Once a plume is detected and mapped, SeekOps converts the raw methane concentration measurements into quantitative emissions estimates. These estimates tell operators exactly how much methane is escaping—not just that a leak exists.
We also integrate this data into dashboards and analytics tools that can be used by field technicians, operations managers, and ESG teams. Combined with GPS coordinates, timestamps, and wind data, plume tracking becomes a powerful decision-making tool.
Making the Invisible Visible
In the fight against climate change, one of the biggest challenges is invisible emissions. Methane plumes are real, measurable, and impactful, but only if you know where to look.
With the SeekIR® sensor and drone-based measurements, SeekOps helps customers visualize, quantify, and eliminate emissions that would otherwise go unnoticed.
From compliance to climate responsibility, understanding methane plumes is a key step toward a lower-emissions future.
Next up: “Turning Data into Insight – Quantifying Emissions with Accuracy.”
Think your facility might benefit from drone-based emissions mapping?
Talk to a Specialist or Get a Sample Survey Report.
Image Credits
Plume dispersion diagram: Adapted from U.S. Environmental Protection Agency (EPA), AERMOD: Description of Model Formulation, EPA-454/R-03-004. Retrieved from https://www.epa.gov/scram/air-quality-dispersion-modeling-preferred-and-recommended-models
Industrial smokestack with visible emissions: Image by Christine Matthews. Retrieved from Geograph UK: https://s0.geograph.org.uk/geophotos/03/22/03/3220320_1df4aa5c.jpg
References
Corbett, A., & Smith, B. (2022). Study of a Miniature TDLAS System Onboard Two Unmanned Aircraft to Independently Quantify Methane Emissions from Oil and Gas Production Assets and Other Industrial Emitters. Atmosphere, 13(5), 804. https://doi.org/10.3390/atmos13050804
Smith, B., Buckingham, S., Touzel, D., et al. (2021). Development of Methods for Top-Down Methane Emission Measurements of Oil and Gas Facilities in an Offshore Environment Using a Miniature Methane Spectrometer and Long-Endurance UAS. Paper presented at the SPE Annual Technical Conference and Exhibition, Dubai, UAE. https://doi.org/10.2118/206181-MS
Tavner, C.A., Touzel, D.F., & Smith, B.J. (2021). Application of Long Endurance UAS for Top-Down Methane Emission Measurements of Oil and Gas Facilities in an Offshore Environment. Paper presented at the SPE Offshore Europe Conference and Exhibition, Virtual. https://doi.org/10.2118/205467-MS
Webster, C. R. (2005). Measuring methane and its isotopes 12CH₄, 13CH₄, and CH₃D on the surface of Mars with in situ laser spectroscopy. Applied Optics, 44(7), 1226–1235. https://doi.org/10.1364/AO.44.001226
Dawson, K. W., Smith, B. J., Stocker, I., & Evans, P. (2024). Assessing the Application of Drone TDLAS Methane Emissions Monitoring Technology in the Intertropical Convergence Zone Using Machine Learning. In APOGCE 2024 (p. D031S020R003). Perth, Australia: SPE. https://doi.org/10.2118/221317-MS
Gully-Santiago, M. A., Smith, B., Frederick, T., Dawson, K., & Elliott, D. (2025). Results and Learnings from the TADI 2024 Methane Quantification Trial. Paper presented at the SPE Europe Energy Conference and Exhibition, Vienna, Austria. https://doi.org/10.2118/225634-MS