Upstream Production Facilities Emission Monitoring
Automation is the Key to Efficiency
10 facilities formed part of this US land-based Leak Detection and Quantification (LDAQTM) study. By planning out the most efficient flight paths to ensure both complete asset coverage, and to enable the assessment of the emissions from individual equipment groups, automated deployment enabled all assets to be covered safely, effectively and efficiently.
Additionally, the waypoints that have now been set up, will facilitate accurate and consistent repeat revisit monitoring at any desired frequency, enabling single person operation, whilst also yielding the ability to monitor the methane concentrations in real time. Additionally, the waypoints that have now been set up will facilitate much faster accurate and consistent repeat revisit monitoring, at any desired frequency, enabling single person operation, whilst also yielding the ability to monitor the methane concentrations in real time.
Having the Unmanned aerial system (UAS) programmed with the automated flight plan also enables the UAS to be launched and recovered remotely from off-site, emphasizing the safe an unobtrusive nature of the operation.
High Resolution Imagery Adds Context
High resolution orthomosaic images taken with the UAS form an up-to-date base map of the location, equipment layout, and can enable resolution down to the centimeter, and allows for easy recognition of any changes to the site. This imagery is gathered and processed using real-time kinematics (RTK) and ground control points for geo-rectification. This geo-rectified imagery enables high volume flight planning. The images below show the difference in quality and detail for low resolution imagery, typically available from online satellite imagery providers on the left, and the accurate high resolution, and up-to-date georectified orthomosaic base map on the left:
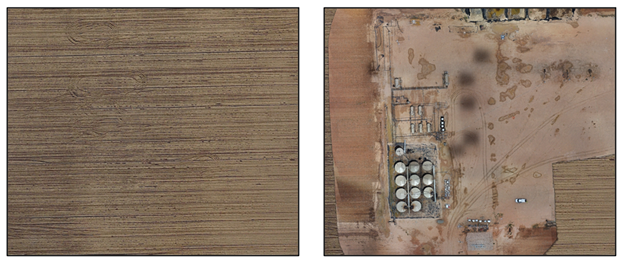
(L) Standard Web-based site image vs (R) high-resolution orthomosaic image.
Automated Flight Path Generation
The imagery is used to identify and outline both equipment groups and any potential obstacles, and with rigorous on-site hazard identification processes working with the customer, ensuring that the drone can safely fly around the site. In the picture below the site setup shows equipment groups that will be assessed in red, and obstacles shaded in yellow, and the designated safe flight paths to be used for the surveys. The right-hand image shows an oblique view of the site, highlighting the drone ‘curtains’ that are uploaded to the vehicle for the automated survey flights.
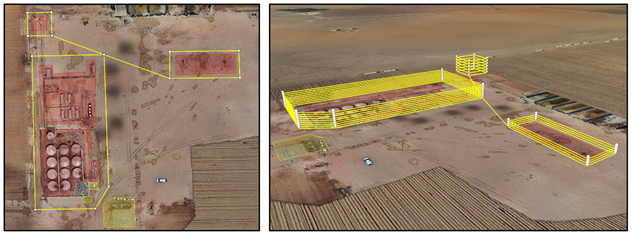
Automated flight plans enable safe and efficient monitoring of equipment groups.
Automated flight profiles were created and executed at all sites. Below we show an example from the above site of the actual flights that were executed. All data acquisition is completely autonomous, with the pilot on location just monitoring the flight. The waypoints are saved for the execution of repeat surveys, either in cases where a leak has been found, and a repair effected, or as part of a periodic systematic monitoring program. It can be seen that the actual flights mimic the plan extremely closely.
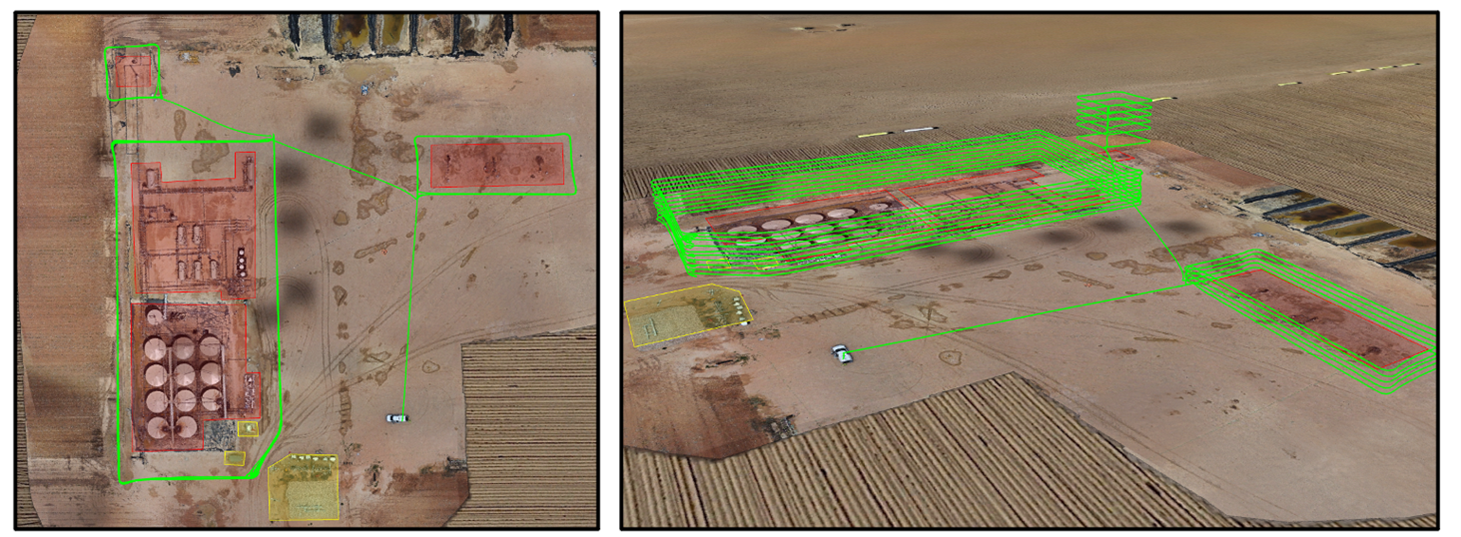
Actual flight paths using automated flight profiles, ensuring consistency and repeatability – essential when monitoring temporal emissions trends.
A short video below highlights the effectiveness of the autonomous flights, including POV perspectives on the proximity to the various equipment groups and the rapidity at which surveys can be undertaken, due the high sensitivity and immediate response of the sensor.
Plan and drone POV views of a typical Permian LDAQTM operation.
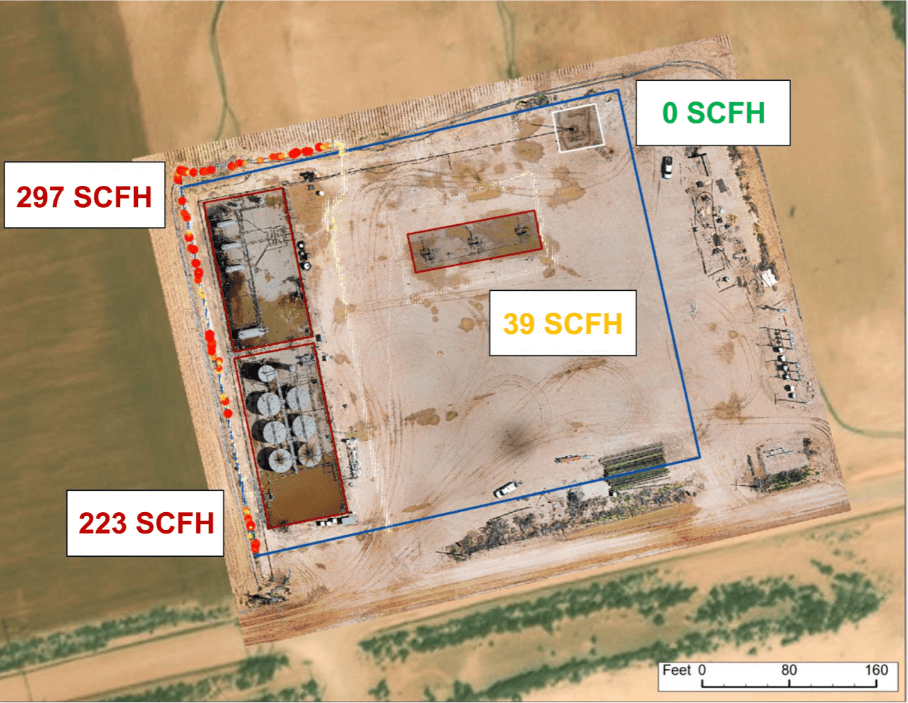
Actual emissions from four separate equipment groups.
Quantification Enables Repair Prioritization
Here we have selected one of the ten sites as representative of the whole survey operation, highlighting how the conversion of the concentration measurements to a flow rate, combined with our proprietary localization algorithms enabled rapid identification of the major leaks, but also helped tabulate the minor leaks, giving the following:
- Total site emissions
- Identification of equipment with highest leaks
- Ability to prioritize repair across all sites
The image below shows the plan view of the locations, and the differing leak rates (in Scf/hr for the 4 key equipment groups. In this case we note that not all equipment was leaking, and that the tanks were the most problematic item on this location. Also highlighted as colored dots are the locations of elevated concentration measurements above the background.
Efficient, Cost-Effective & Consistent
Of the ten sites surveyed, each had between 2 and 4 equipment groups surveyed; all had at least one piece of equipment emitting.
The total flight time for the 10 sites (which are spread over approximately 66 square miles) was a little over 3 hours, with an average flight time per site of about 17 minutes, highlighting the efficiency of the UAS. This model, with the automated plans reproducible on-demand, is scalable to the other 75+ sites owned by this operator in the Permian, and will enable all sites to be quantified in less than a week.
The operator is currently performing repairs to the equipment highlighted by this study, and those sites will be resurveyed post-repair, with results updated here shortly.
Speak to our Team
Interested in how SeekOps can drive value for your team in the field?